Landsat 8/9 · Thermal band 10 · Deep learning
See heat.
In colour.
IRVision turns single-band thermal satellite images into readable colour images, then checks that the result still shows the same water, fields and cities as reality.
- 10
- Landsat scenes
- 1.6 s
- per 60 km scene
- 8×
- more land cover kept
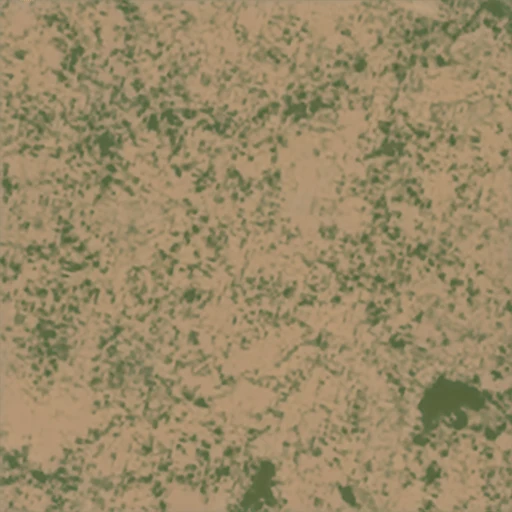
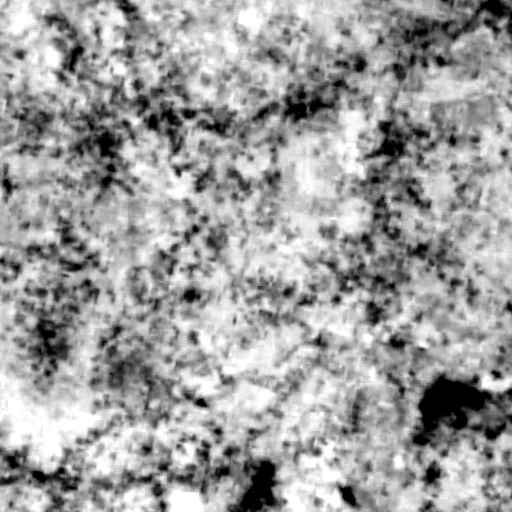
Hyderabad farmland: a city the model never saw during training. Drag to compare.
How it works
One image. Ten steps. Every one measured.
From raw satellite temperature to a colour image and its own quality report, in about a second on a laptop GPU.
Validation: Single band, size limits, no-data mask
01
Enhance
Clouds and missing data are masked; local contrast is boosted so faint thermal structure becomes visible.
02
Colorize
A U-Net trained on 1,297 Landsat patches from nine cities predicts the true-colour image from heat alone.
03
Verify
A land-cover model compares water, vegetation and built-up areas in the colorized and the real image.
04
Report
PSNR, SSIM, land-cover agreement and per-stage timing, computed on every run.
Try it
Watch the pipeline work.
Choose a scene from Hyderabad, a city the model never saw. Results are real outputs of the trained models, pre-computed for this demo.
Input
Pipeline
Ready
$ irvision process --input … # press Run
Results
Measured, not claimed.
Tested on 355 image patches, including a whole city, Hyderabad, that was never used for training. Every number below comes from an evaluation script.
Structure preserved (SSIM)
Unseen city · higher is better
Meaning preserved (land-cover mIoU)
Colorized vs. real image · all test patches · model ceiling —
Colour accuracy (PSNR)
All test patches · higher is better
On the unseen city, colour accuracy matches the lookup table ( vs. dB); the model’s advantage there is structure and meaning.
Land cover, class by class
IoU of IRVision colour vs. real image
Water and vegetation survive colorization; dense city does not yet. Colour metrics alone would not show this.
Who it helps
Readable heat for people who need it.
Thermal imagery is valuable but hard to interpret. IRVision makes it accessible, and says how far to trust it.
Disaster response
Thermal sensors keep imaging at night. A colour view makes flood-affected areas readable for responders who are not remote-sensing experts, and water is the class IRVision preserves best.
Agriculture
Fields and vegetation are preserved well, and heat already signals irrigation and crop stress. Colorized views are easier to share with farmers and local officials.
Water management
Lakes, reservoirs and rivers stand out clearly in the colorized output, with 0.74 land-cover agreement for water.
Climate research
Pair measured surface temperature with a readable visual of the same scene for reports and field teams.
Education
Make satellite thermal data understandable for students and the public, with an honest quality score on every image.
Not yet: urban mapping
Our own validation shows dense built-up areas come out looking like vegetation. Don’t use the output to judge city extent. Fixing this is the next step.